Thursday, June 26, 2014

Remixing with deck

When I saw Dave Cheney's splendid talk, "Five things that make Go fast", I wanted to see if deck, a Go package for presentations could replicate and perhaps improve an existing, well designed presentation.

Here is my remix, and its source made with pdfdeck, a deck client.

I tried to remain faithful to Dave's deck, but I did take some liberties: In some cases I replaced bullet lists with prose, (used to good effect with the CPU registers slide), and I redesigned the Thank-you slide a bit, and in one case replaced an image with a custom illustration (see slide 3).

Except for the CPU speed graph and the CPU cache photo, all of the illustrations were done with directly with deck markup. Also, I used highlighting to emphasize points in the code samples.

Dave's original deck uses Japanese glyphs, and because of a limitation of the PDF library that pdfdeck uses, I had to use images. (note that svgdeck, another deck client, does not have this limitation).

Here is the command line used to produce the deck:

pdfdeck -fontdir $df -serif Charter\ Regular -sans FiraSans-Regular -mono FiraMono-Regular -pagesize 1280,720 gofast.xml

This deck uses Fira Sans and Fira Mono for the main text and code, along with Charter for lists and blocks of prose. (see Matthew Butterick's Practical Typography on font choices). The directory pointed to by $df is where font files are stored; pdfdeck can use any TrueType font, which is nice --- you can try font combinations without changing the markup --- just change the font name in the command line, and re-run. Note that deck only knows about (by design), three font families (sans, serif, and mono). This imposes some discipline, and keeps the designs sane. Finally, the command preserves the 1.777 (16:9 "widescreen") aspect ratio of the original.

Remixing an existing presentation was a fun exercise, and I picked up a few more techniques along the way. Thanks to Dave for letting me use his original work.

If you want try deck and pdfdeck:

go get github.com/ajstarks/deck
go get github.com/ajstarks/deck/cmd/pdfdeck

For more information, check out the deck on deck, and its source.

Saturday, May 18, 2013

Visualizing Go Benchmarks with benchviz

It's often useful to compare benchmark results between Go releases or your own programs. A new tool, benchviz, written in Go with the SVGo package, makes SVG visualizations designed to help you spot regressions and speedups and their magnitudes quickly.

Benchviz reads data from the benchcmp command, found in $GOROOT/misc/benchcmp, which produces output like this:

$ benchcmp old new
benchmark                 old ns/op    new ns/op    delta
BenchmarkBinaryTree17  131488202467 112637283111  -14.34%
BenchmarkFannkuch11     61976254131  61972329989   -0.01%
BenchmarkGobDecode        424145307    383073401   -9.68%
BenchmarkGobEncode        115032849    120332484   +4.61%
BenchmarkGzip           13868472766  13493855517   -2.70%

benchmark                  old MB/s     new MB/s  speedup
BenchmarkGobDecode             1.81         2.00    1.10x
BenchmarkGobEncode             6.67         6.38    0.96x
BenchmarkGzip                  1.40         1.44    1.03x
BenchmarkGunzip               11.23        11.55    1.03x

The benchcmp command produces two kinds of comparisons. "delta-style" shows the percent change between the measurements (negative numbers for going faster, positive numbers for slowdowns). The "speedup-style" shows how many times faster or slower the benchmarks are. Measurements less than 1.0 are considered performance regressions.

Benchviz supports two styles: the "bar" style draws a barchart-like view; regressions point to the left and speedups go to the right. The "inline" view shows portportionally-sized bars as "highlights" over the benchmark names. In both cases, colors indicate speedups or regressions.

If you add lines to the benchcmp output beginning with '#', benchviz will display these comment lines appropriately

Bars and inline styles

Two styles of speedup benchmarks

To install benchviz:

$ go install github.com/ajstarks/svgo/benchviz

You can run benchviz in a pipeline:

$ benchcmp old new | benchviz > bench.svg

or it can read from files:

$ benchviz linux-amd64-282dcbf1423.txt > linux.svg

Benchviz has options to control layout (overall width and height, top and left margins; the location and size of the bars; maximum speedup and delta) and style (bars or inline, colors, horizontal rules, single column data view)

$ benchviz -?
flag provided but not defined: -?
Usage of benchviz:
  -bh=20: bar height
  -col=false: show data in a single column
  -dm=100: maximum delta
  -h=768: height
  -left=100: left margin
  -line=false: show lines between entries
  -rcolor="red": regression color
  -scolor="green": speedup color
  -sm=10: maximum speedup
  -style="bar": set the style (bar or inline)
  -title="": title
  -top=50: top
  -vp=512: visualization point
  -vw=300: visual area width
  -w=1024: width

Thanks to Dave Cheney and Andrew Gerrand for feedback and encourgement.

Tuesday, September 25, 2012

OpenVG on the Raspberry Pi

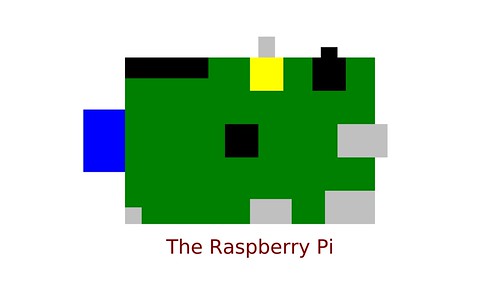
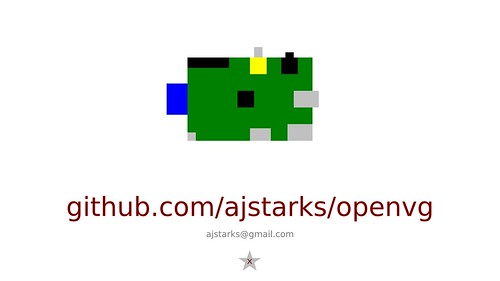
The Raspberry Pi, drawn by the Raspberry Pi

The Raspberry Pi includes a GPU-backed OpenVG standard library, making it an excellent platform for graphics programming. This post describes a high-level library written on top of OpenVG that can be used with either C or Go.

Design

The library, hosted at Github, is a thin layer on top of the native OpenVG library (see /opt/vc/lib), adopting its coordinate system (origin at the lower left, x increasing to the left-to-right, y increasing up), and types (floating point coordinates and dimensions).

The library is designed to be small and logical---a programmer should be be able to keep the entire API in their head, and at a glance get a sense of what a client program will do. The usual pattern is to define programs in terms of functions that use high-level graphics objects likes circles, lines, and curves, with little to no barrier between the conception of the design and its programmed realization---the library is designed to get to the pictures quickly, with a minium of ceremony and boilerplate. If a picture can be created with a vector drawing tool, the designer/programmer should be able to create an equivalent (or better) illustration using the library.

Another measure of the API is its ability to program pictures defined in other APIs such as Processing or SVGo.

API

The API is organized in terms of shapes, lines, curves, text, images, attributes, and transformations. (note that the library adopts Go's convention of using upper-case names for "public" functions)

Shapes, lines and curves
Circle(x,y,r) Circle centered at (x,y) with radius r
Ellipse(x,y,w,h) Ellipse centered at (x,y), with radii w, h
Rect(x,y,w,h) Rectangle with lower left at x,y width of w, height of h
Roundrect(x,y,w,h,rw,rh) Rounded rectangle with lower left at (x,y), width (w), height (h), corner radii (rw,rh)
Line(x1,y1, x2,y2) Line between (x1, y1) and (x2, y2)
Polyline(x,y) Polyline with coordinates in (x,y) arrays
Polygon(x,y) Polygon with coordinates in (x,y) arrays
Arc(x,y,w,h,a1,a2) Arc centered at x,y width (w), height (h), between angles a1,a2
Cbezier(bx,by, cx,cy, px,py, ex,ey) Cubic Beziér curve between (bx, by) and (ex, ey), with control points at (cx,cy) and (px,py)
Qbezier(bx,by, cx,cy, ex,ey) Quadratic Beziér curve between (bx, by) and (ex, ey), with the control point at (cx,cy)
Image and Text
Image(x,y,w,h,name) Place the JPEG image file "name", and dimensions of (w,h) at (x,y)
Text(x,y,s,font,size) Place the text in s at (x,y), set in the named font and size
TextMid(x,y,s,font,size) Align the text centered at (x,y), set in the named font and size
TextEnd(x,y,s,font,size) Align the text with its end at (x,y), set in the named font and size
TextWidth(s,font,size) Return the width of a string of text set in the named font and size
SerifTypeface Specifies the built-in serif typeface (Deja Vu Sans)
SansTypeface Specifies the built-in sans-serif typeface (Deja Vu Serif)
MonoTypeface Specifies the built-in monospaced typeface (Deja Vu Sans Mono)
Attributes
Fill(red,green,blue,alpha) Set the fill color specified by the (red,green,blue) triple. Color transparency is defined by alpha
FillLinearGradient(x1,y1,x2,y2,stops,n)Linear gradient fill
FillRadialGradient(cx,cy,fx,fy,r,stops,n)Radial gradient fill
Stroke(red,green,blue,alpha) Set the stroke color
StrokeWidth(w) Set the stroke width
Background(red,green,blue) Set the background color
Transformations
Translate(x,y) Translate the coordinate system to (x,y)
Scale(x,y) Scale the coordinate system by (x,y)
Shear(x,y) Warp the coordinate system by (x,y)
Rotate(r) Rotate the coordinate system around the angle r (degrees)
Structure
init() Graphics initialization
finish() Graphics cleanup
Start(w,h) Begin the picture
End() End the current picture
SaveEnd(filename) Save the raw raster to filename, and empty string saves the raster to the standard output file

Text is rendered with TrueType fonts, using data generated by an included separate program, font2openvg. The library embeds data for sans, serif and monospace fonts in a single weight. Other fonts may be added if needed. The format for saved pictures is a stream of RGBA values, in scanline order, sized to the display. The included Go program raw2png converts the raw raster files to PNG.

Here's a "reference card" for the library, built with itself:
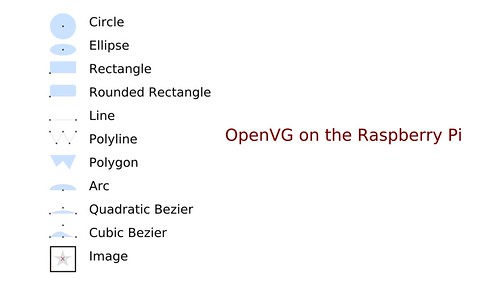
OpenVG refcard

Here is the formal description of the C API

Examples

Every first program displays "hello, world" -- here is the graphics equivalent.

// first OpenVG program
#include <stdio.h>
#include <stdlib.h>
#include <unistd.h>
#include "VG/openvg.h"
#include "VG/vgu.h"
#include "fontinfo.h"
#include "shapes.h"

int main() {
    int width, height;
    VGfloat w2, h2, w;
    char s[3];

    init(&width, &height);                                      // Graphics initialization

    w2 = (VGfloat)(width/2);
    h2 = (VGfloat)(height/2);
    w  = (VGfloat)w;

    Start(width, height);                                       // Start the picture
    Background(0, 0, 0);                                        // Black background
    Fill(44, 77, 232, 1);                                       // Big blue marble
    Circle(w2, 0, w);                                           // The "world"
    Fill(255, 255, 255, 1);                                     // White text
    TextMid(w2, h2, "hello, world", SerifTypeface, width/10);   // Greetings 
    End();                                                      // End the picture
    fgets(s, 2, stdin);                                         // Pause until RETURN]
    finish();                                                   // Graphics cleanup
    exit(0);
}
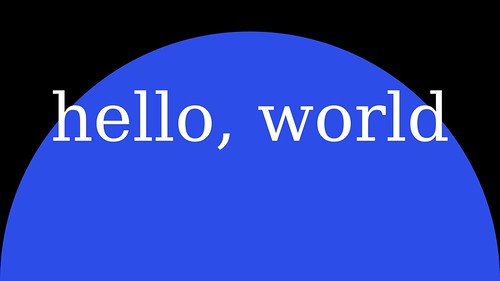
hellovg

This example is a function to rotate text:

// rotext draws text, rotated around the center of the screen, progressively faded
void rotext(int w, int h, int n, char *s) {
    VGfloat fade = (100.0 / (VGfloat) n) / 100.0;
    VGfloat deg = 360.0 / n;
    VGfloat x = w / 2, y = h / 2;
    VGfloat alpha = 1.0;    // start solid
    int i, size = w / 8;

    Start(w, h);
    Background(0, 0, 0);
    Translate(x, y);
    for (i = 0; i < n; i++) {
        Fill(255, 255, 255, alpha);
        Text(0, 0, s, SerifTypeface, size);
        alpha -= fade;             // fade
        size += n;                 // enlarge
        Rotate(deg);
    }
    End();
}

rotext

The Go Package

Thanks to the work of the Go community, specifically Dave Cheney and Shenghou Ma (known as minux on the Go mailing lists), Go is a first-class language on the Raspberry Pi -- building a Go version of the library is straightforward using cgo. When building Go initially on your Raspberry Pi, it's useful to decrease the GPU RAM, but once it's built, you will need at least 64MB of GPU RAM to run the programs. Use the raspi-config program to adjust your memory split. While you are there, experiment with the new "Turbo" overclocking mode. Your builds will go faster.

The key to a successful build is respecting the Go toolchain conventions -- the code is built under $GOPATH/src/github.com/ajstarks/openvg, so that during development I can say:

$ cd $GOPATH/src/github.com/ajstarks/openvg
$ go install .
$ cd go-client/shapedemo
$ go run shapedemo.go demo 1

Incidentally, I grew weary of the twitchiness of editing using vi over ssh on my Mac, and using Plan 9 from user space, I can use the text editor sam between the Raspberry Pi and the Mac for much more responsive editing.
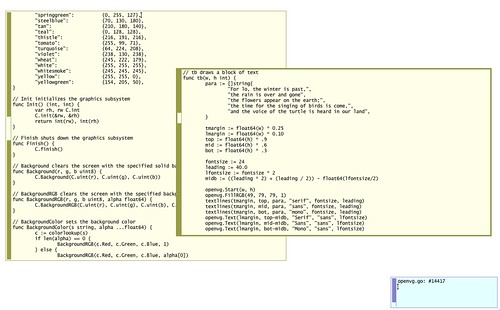
Sam editing openvg files on the Raspberry Pi

The Go version includes with a few niceties such as named colors, and in general, where the C library uses arrays, Go uses slices, and where OpenVG uses the VGfloat type the Go package uses float64. Also, the C library only supports JPEG images, but the Go library supports both JPG and PNG image formats, thanks to the standard image library.

A formal description of the Go API

Here is the Go version of the hellovg program:

// first OpenVG program
package main

import (
    "bufio"
    "github.com/ajstarks/openvg"
    "os"
)

func main() {
    width, height := openvg.Init()                            // Graphics initialization

    w2 := float64(width / 2)
    h2 := float64(height / 2)
    w := float64(width)

    openvg.Start(width, height)                               // Start the picture
    openvg.BackgroundColor("black")                           // Black background
    openvg.FillRGB(44, 77, 232, 1)                            // Big blue marble
    openvg.Circle(w2, 0, w)                                   // The "world"
    openvg.FillColor("white")                                 // White text
    openvg.TextMid(w2, h2, "hello, world", "serif", width/10) // Greetings 
    openvg.End()                                              // End the picture
    bufio.NewReader(os.Stdin).ReadBytes('\n')                 // Pause until [RETURN]
    openvg.Finish()                                           // Graphics cleanup
}

The rotext function:

// rotext draws text, rotated around the center of the screen, progressively faded
func rotext(w, h, n int, s string) {
    fade := (100.0 / float64(n)) / 100.0
    deg := 360.0 / float64(n)
    x := float64(w) / 2.0
    y := float64(h) / 2.0
    alpha := 1.0
    size := w / 8

    openvg.Start(w, h)
    openvg.Background(0, 0, 0)
    openvg.Translate(x, y)
    for i := 0; i < n; i++ {
        openvg.FillRGB(255, 255, 255, alpha)
        openvg.Text(0, 0, s, "serif", size)
        alpha -= fade // fade
        size += n     // enlarge
        openvg.Rotate(deg)
    }
    openvg.End()
}

Building and running

You will need at least 64MB of GPU RAM, and the only other dependecy is the JPEG library, install it like this:

$ sudo apt-get install libjpeg8-dev

Makefiles control the building of the C library and its clients.

$ make                             # builds the C and Go libraries
$ cd client  
$ make test                        # builds C clients

$ ./shapedemo                      # show a reference card
$ ./shapedemo advert               # show the library "billboard"
$ ./shapedemo raspi                # show a self-portrait
$ ./shapedemo image                # show test images
$ ./shapedemo astro                # the sun and the earth, to scale
$ ./shapedemo text                 # show blocks of text in serif, sans, and mono fonts
$ ./shapedemo rand 100             # show 100 random shapes
$ ./shapedemo rotate 10 a          # rotated and faded "a"
$ ./shapedemo gradient             # show linear and radial gradient fills
$ ./shapedemo test "hello, world"  # show a test pattern, with "hello, world" at mid-display in sans, serif, and mono.
$ ./shapedemo fontsize             # show a range of font sizes (see Better Products Through Typography)
$ ./shapedemo demo 10              # run through the demos, pausing 10 seconds between each one.

The Go package and clients are built using the go tool: (make sure you are on a recent Go release. As of this writing, the openvg library has been tested on Go 1.1 and 1.1.1

$ go get github.com/ajstarks/openvg
$ go install github.com/ajstarks/openvg/...

The Go clients include:

  • shapedemo -- cycle through several demos (see above)
  • colortab -- named color table
  • raspi -- the Raspberry Pi self-portait
  • hellovg -- hello (graphics) world
  • randcircle -- show random circles

randcircle

Issues and Opportunities

The library is young, and can be improved: the font handling is less than ideal, and Rob Bishop of the Raspberry Pi foundation has pointed out the Raspberry Pi includes a vector font library. The handling of image data between Go and C is not optimal and is the only performance regression between the Go and C versions of the library. Other areas of improvement include better handing of paths (currently the library creates and destroys paths for each graphics object, negatively effecting performance), and adding mouse and keyboard handling. Image handling and scaling can also be improved.

The API is fairly stable, and I'd like to see what kind of programs can be written, letting real-world needs drive API changes (gradient fills are on the to-do list). UPDATE: linear and gradient fills were added on October 2, 2012

Example programs include graphical information/status displays, where portions of the display can be updated concurrently using goroutines, or even presentation software that works from a simplified markup. (try the Go version of the shapedemo with the "loop" argument for a hint of what's possible). The library could also be the basis of a graphics learning environment that is takes advantage of fully accelerated 2D-graphics.

Happily, there is very little Raspberry Pi-specific code, so theoretically the library could be ported to any system that supports OpenVG, useful in future GUI framework and tools.

Have fun programming pictures on your Raspberry Pi
advert

Wednesday, July 11, 2012

AIGA Symbols

AIGA Symbols by ajstarks
AIGA Symbols, a photo by ajstarks on Flickr.

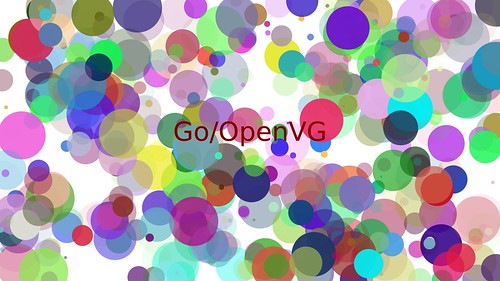
This display of AIGA symbols from The Noun Project was created with the SVGo library and the "nouns" program.

nouns -j -n 10  aiga/*.svg

The program works by loading SVG files from thenounproject, wrapping them in group elements, and then applying random location, scale, color, opacity, and rotation. These properties are define by the type:

type Props struct {
    x, y    int
    c       string
    s, o, r float64
}

Here's the function that does the work:

func Jumble(s *svg.SVG, icons []string, w, h, n int) {
    for c := 0; c < n; c++ {
        for _, i := range icons {
            RandProps(w, h).Apply(s, i)
        }
    }
}

Given a list of icons names, defined by SVG group ids, create and apply random properties bound by a width and height to the ids

Saturday, June 30, 2012

Raspberry Pi and SVGo tools

Raspberry Pi and SVGo tools by ajstarks
Raspberry Pi and SVGo tools, a photo by ajstarks on Flickr.

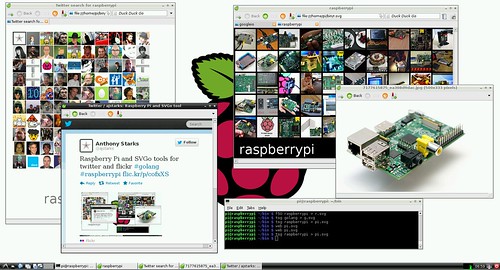
Here's a screenshot of SVGo tools running on the Raspberry Pi. On the left is tsg (twitter search grid) referring to twitter posts mentioning raspberrypi and on the is left f50 (flickr50) showing flickr photos tagged with raspberrypi.

Both tools produce links to detail -- a tweet and the actual flickr photo.

The Raspberry Pi is using the Midori browser to show the SVG content generated by the tools in the terminal window.

Sunday, April 22, 2012

Tumblr Grid

Attending the inaugural golang ny group at the Tumblr offices, inspired me to add tumblrgrid to the collection of SVGo clients. Tumblrgrid makes a SVG file that displays a flexible, clickable grid of pictures from a set tumblr blogs, possibly filtered with tags. Data may be read from a live network or from a local cache. You can get tumblrgrid with:
$ go get github.com/ajstarks/svgo/tumblrgrid
You will need to edit the source to add your own tumblr API key. The command options are:
 -f=false: read from local files
 -g=5: gutter (pixels)
 -n=30: picture limit
 -nc=5: number of columns
 -p=false: link to original post
 -tag="": filter tag
 -tw=75: thumbnail width
An interesting use of tumblrgrid is to view pictures from related tumblrs. For example, this list:
f0o0od.tumblr.com
ign0ranceisbliiiss.tumblr.com
agilaagira.tumblr.com
geek-art.tumblr.com
represents a chain of tumblrs that refer to each other. After collecting them in a file called tlist, this command line:
$ tumblrgrid -nc 4 -n 20 `cat tlist`
produces:
Changing the command line to
$ tumblrgrid -nc 2 -n 20 `cat tlist`
reduced the number of columns to 2 which causes the labels to be rotated.

Saturday, October 15, 2011

Documenting Code and Pictures

For the SVGo workshop I had to document many examples of code+pictures, so I created a workflow to create consistently formatted illustrations of SVGo code and the pictures they produce. Below is the script that automates the process. The heart of the script is a small Go program, codepic which creates a SVG file of code and picture:
Here's the script:
#!/bin/sh
for i in $*
do
    base=`basename $i .go`
    gofmt -w -spaces -tabindent=false -tabwidth=4 $i &&
    goc $base && 
    ./${base} > ${base}.svg && 
    codepic -codeframe=f -font Inconsolata -fs 14 -ls 16 $i > ${base}-slide.svg && 
    svg2pdf ${base}-slide.svg
done
for each file the script:
  1. formats the source
  2. builds the source
  3. runs the program and captures its output
  4. make a slide showing the code and output
  5. convert the slide to PDF for inclusion in Keynote

Sunday, August 7, 2011

Stock/Product Comparisons with SVGo


The latest visualization tool written with SVGo is stockproduct, a tool to compare stock prices with the release of products over time. This is a Go version of the tool described earlier. Like other SVGo tools, stockproduct reads data from XML (see example below) and produces SVG.

<stockproduct title="Apple Purchases and Stock Price">
<sdata price="12.40" date="2002-04" product="Ti PowerBook" image="tipb.jpg"/>
<sdata price="7.38" date="2002-08" product="Jaguar" image="jaguar.png"/>
<sdata price="261.09" date="2010-04" product="iPad 3G" image="ipad3g.jpg"/>
<sdata price="399.68" date="2011-07" product="Lion" image="lion.png"/>
</stockproduct>

The example above plots my purchases of Apple products vs. the stock price.

Stockproduct scales the graph by the specified size, and the graph can be placed anywhere on the SVG canvas. Note that every chart component: bars, images, product names. prices, scales, and images may be turned on and off using command line options.

This example:

compares the adjusted closing price vs. operating system releases from Microsoft and Apple, ordered by the date of release. Between 1991-2001, both organizations were able to keep pace, with Microsoft releasing Windows 3.1, 95, 98, and Apple releasing System 7, 8, and 9.

However, between 2001 and 2005 Apple steadily released five versions of Mac OS X (Cheetah, Puma, Jaguar, Panther, and Tiger), but in the same time period, Microsoft released only XP. After 2005, Apple released Leopard, Snow Leopard and Lion, where Microsoft released VIsta and Windows 7.

From 1991-2007, there were no large differences in stock prices, but in 2007, the there was large gain for Apple, growing from $184.70 to $386.90, with Microsoft's price staying flat, at $23.75 at the release of Windows 7 in 2007.

In fact the range of prices and releases during past 20 years is Microsoft: $2-23.75, and 6 operating system releases, with Apple's stock price ranging from $4.11 - $386.90, with 11 operating system releases (not including iOS).

Here's the same data with Apple products on the left, peaking at Lion, and Microsoft products on the right:

Monday, July 11, 2011

Bullet Graphs with SVGo


Bullet Graphs

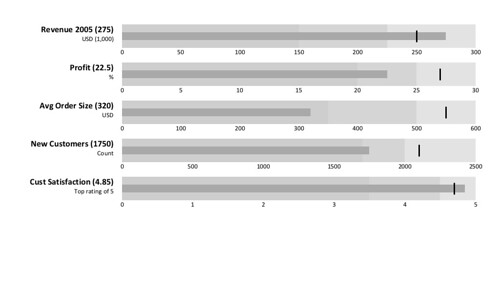
Here is the output of bulletgraph -- an implemetation of Few's Bullet Graphs using SVGo. Like pmaps, bulletgraph reads a XML representation of the data, unmarshals the input into data structures, and produces the bullet graph from the structures. The input looks like this:

<bulletgraph>
<bdata title="Revenue 2005" subtitle="USD (1,000)"
scale="0,300,50" qmeasure="150,225" cmeasure="250" measure="275"/>
</bulletgraph>

Each bdata element produces a graph according to its attributes (titles, scales, and measures)

The program has various options to control colors of the various components (data color, comparative color, target color), and the indicator showing the target measure can either be the conventional vertical line or a circle. The -help option shows all of the option flags, with an example XML definition.

bulletgraph -help

Usage: bulletgraph [options] file...

-bc="rgb(200,200,200)": bar color
-bg="white": background color
-bh=48: bar height
-cc="black": comparative color
-circle=false: circle mark
-dc="darkgray": data color
-f=18: fontsize (px)
-g=30: gutter
-h=800: height
-help=false: usage and example
-showtitle=false: show title
-t="Bullet Graphs": title
-w=1024: width

Example Defintion:

<bulletgraph top="50" left="250" right="50">
<bdata title="Revenue 2005" subtitle="USD (1,000)" scale="0,300,50" qmeasure="150,225" cmeasure="250" measure="275"/>
<bdata title="Profit" subtitle="%" scale="0,30,5" qmeasure="20,25" cmeasure="27" measure="22.5"/>
<bdata title="Avg Order Size" subtitle="USD" scale="0,600,100" qmeasure="350,500" cmeasure="550" measure="320"/>
<bdata title="New Customers" subtitle="Count" scale="0,2500,500" qmeasure="1700,2000" cmeasure="2100" measure="1750"/>
<bdata title="Cust Satisfaction" subtitle="Top rating of 5" scale="0,5,1" qmeasure="3.5,4.5" cmeasure="4.7" measure="4.85"/>
</bulletgraph>
Thanks to Richard Masci for the example usage suggestion.

Monday, May 16, 2011

Google Web Fonts, SVGo and code sketching with goplay


SVGo and Google web fonts
This program, webfonts, demonstrates Google Web Fonts and its API with SVGo. The key to its operation is the URI:
http://fonts.googleapis.com/css?family={fonts}

where {fonts} is a pipe-delimited list of font names. The result of performing a HTTP GET on this URI is CSS code that specifies the fonts. For example,

http://fonts.googleapis.com/css?family=Pacifico 
produces:
@font-face {
font-family: 'Pacifico';
font-style: normal;
font-weight: normal;
src: local('Pacifico'), url('http://themes.googleusercontent.com/font?kit=fKnfV28XkldRW297cFLeqfesZW2xOQ-xsNqO47m55DA') format('truetype');
}

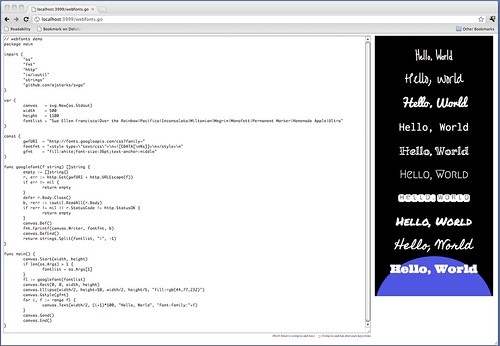
The program works by using a Go function to perform the GET (googlefont(fontname string)), and place the resulting CSS in a SVG defs element. The program is then able to use the web fonts by name just like any other local font. In this case looping over the names in the list, and displaying "Hello, World" in the corresponding font.

The screenshot shows the code and output in Google Chrome (although any modern browser that can handle inline SVG will work), using a web app that comes with the Go distribution, goplay. Goplay allows you to "play" with snippets of Go code and quickly compile and see the results in a web browser. In the case of programs like the one shown, the generated SVG is placed in-line, interpreted directly, showing the picture.

Here's how to run it: go to a directory where your code lives, and then run goplay -html, which sends the results unaltered to the browser, instead of in a plain text block. A word of caution from the goplay documentation: anyone with access to the goplay web interface can run arbitrary code on your computer. Goplay is not a sandbox, and has no other security mechanisms. Do not deploy it in untrusted environments.

cd [dir]
goplay -html
Next, point your browser to the content served by goplay (which listens on localhost, port 3999 by default):

http://localhost:3999/webfonts.go

Your code will be shown in the textarea, ready to be edited and built. Hit Shift-ENTER and code is compiled and run with the output next to the code. If you want to tweak the program, by changing say, a font name or the string to be displayed, just move to the textarea, make the change, and hit Shift-ENTER again. This method allows you to sketch in code, with immediate feedback.

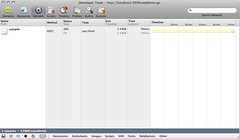
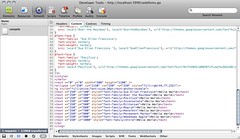
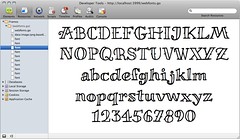
With the WebKit Inspector found in Chrome and Safari, you can examine timing, code, and font information.


SVGo and Webfonts: network timing

SVGo and Webfonts: generated code

SVGo and Webfonts: font resource

Monday, November 1, 2010

Mobile Market Share: 2010


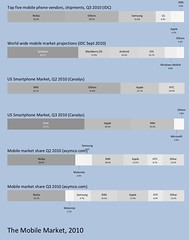
Mobile Market Share: 2010
Originally uploaded by ajstarks
Here is a collection of pmaps that outline the changing mobile market share. The data is from Canalys, IDC, CNet, and Asymco.com

Thursday, October 7, 2010

Proportional Maps: an alternative to pie charts

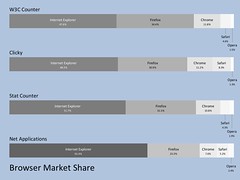
Proportional maps (pmaps) are an alternative to the venerable pie chart for showing the how a set of data adds up to a whole.

Pmaps are designed to show the data more clearly than pie charts by using color (the darker the color the greater the proportion), size (the width of the rectangle corresponds to the data's proportion) and position (the data is ordered from greater to least proportion).

The compact nature of pmaps allows you to compare related datasets by scanning vertically. For example the illustration shows how different sources report browser market share.

The pmap program is implemented in the Go programming language, and produces SVG via the svgo library

The program has various strategies to clearly show all the data: you may show any combination of labels, percentages, or raw data. The labels and data are automatically arranged for maximum visibility: if the data rectangle is too narrow, its labels is displayed as a call out. (the thresholds for label length and data size are adjustable). The style of call out is also configurable: staggered or alternating between above and below the data)

The command line:

pmap -stagger -p -g 100 -bg lightsteelblue -t "Browser Market Share" -showtitle bs.xml > bs.svg
created the illustration above. It means: read data from bs.xml, create the pmap as a SVG file called bs.svg, stagger the overflow labels, show percentages, separate each map with 100 pixels, create a contrasting background, and display a title.

The input XML format is simple: a pmap consists of one or more data sets (pdata elements), which in turn contain items with a corresponding value:
<pmap>
<pdata legend="W3C Counter">
<item value="43.2">Internet Explorer</item>
<item value="31.2">Firefox</item>
<item value="10.7">Chrome</item>
<item value="4.2">Safari</item>
<item value="1.4">Opera</item>
</pdata>
</pmap>

Friday, August 13, 2010

A quick tour of Go's dict package

The 2010-08-11 release of the Go programming language includes the dict package to talk to dictionary servers as defined by RFC 2229. Let's check it out.

First, here's a mimimal program that uses the Dial() and Define() functions to display a definition.

package main

import "net/dict"

func main() {
c, _ := dict.Dial("tcp", "dict.org:2628")
defn, _ := c.Define("wn", "go")
for _, result := range defn {
println(string(result.Text))
}
}


This program does no error checking, and has three hardcoded bits: the server (dict.org:2628), the database ("wn") and word to lookup ("go").

For the next version, let's add some flexibility -- lookup items specified on the command line, and let's add some error checking and cleanup:

package main

import (
"net/dict"
"os"
)

func main() {
c, neterr := dict.Dial("tcp", "dict.org:2628")
if neterr == nil {
defer c.Close()
for _, word := range os.Args {
defn, deferr := c.Define("wn", word)
if deferr == nil {
for _, result := range defn {
println(string(result.Text))
}
}
}
}
}

Ok, great, what if you want to switch databases? You can ask the server. If you run the command with no arguments, it will list the available databases using the Dicts() function:

package main

import (
"net/dict"
"os"
)

func main() {
c, neterr := dict.Dial("tcp", "dict.org:2628")
if neterr == nil {
defer c.Close()
if len(os.Args) == 0 {
dicts, dicterr := c.Dicts()
if dicterr == nil {
for _, dl := range dicts {
println(dl.Name, dl.Desc)
}
}
} else {
for _, word := range os.Args {
defn, deferr := c.Define("wn", word)
if deferr == nil {
for _, result := range defn {
println(string(result.Text))
}
}
}
}
}
}

One more update: let's add flags to specify the dict server and database. We'll also update the error processing to show the errors instead of failing silently:

package main

import (
"net/dict"
"flag"
"fmt"
)
var (
db = flag.String("d", "wn", "Dictionary database")
dserver = flag.String("s", "dict.org:2628", "Dictionary Server")
)

func main() {
flag.Parse()
c, neterr := dict.Dial("tcp", *dserver)
if neterr == nil {
defer c.Close()
if len(flag.Args()) == 0 {
dicts, dicterr := c.Dicts()
if dicterr == nil {
for _, dl := range dicts {
fmt.Println(dl.Name, dl.Desc)
}
} else {
fmt.Println(dicterr)
}
} else {
for _, word := range flag.Args() {
defn, dferr := c.Define(*db, word)
if dferr == nil {
for _, result := range defn {
fmt.Println(string(result.Text))
}
} else {
fmt.Println(dferr)
}
}
}
} else {
fmt.Println(neterr)
}
}

There you go--a robust, flexible dictionary client in a little over 40 lines of code.

Friday, April 16, 2010

Font Specimens with SVG

These font specimens were created with SVGo, patterned after the specimens found in wikipedia

Calibri and Times Roman

Here are the current and past defaults for Microsoft Office, Calibri and Times Roman

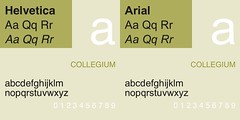
Helvetica and Arial
The original vs. the knock-off: Helvetica and Arial.

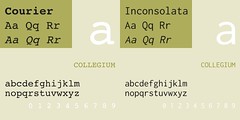
Courier and Inconsolata

And finally, the canonical mono-spaced font Courier compared to Inconsolata, my current go-to monofont

Wednesday, March 24, 2010

Leaning Flowers


Here is another variation of grain2. It's like the "flower" program, but it includes stems, and a porportion of "lean" (0 - full lean to the left, 100 - full lean to the right) is programmed in.

The variations were produced with this script:


for i in 0 25 50 75 100
do
./grain -n 150 -w 900 -h 200 -l 175 -nl $i > grain$i.svg
done


Grain 0


Grain 25


Grain 50


Grain 75


Grain 100

Here's the Go program


// grain -- flowers with programmable lean

package main

import (
svglib "./svg"
"time"
"rand"
"os"
"flag"
"fmt"
"math"
)

var (
width = flag.Int("w", 500, "width")
height = flag.Int("h", 500, "height")
ninter = flag.Int("n", 75, "interations")
stemlen = flag.Int("l", 450, "stem length")
stemwidth = flag.Int("st", 4, "stem thickness")
numleft = flag.Int("nl", 50, "percentage of left-leaning stems")
thickness = flag.Int("t", 10, "max petal thinkness")
np = flag.Int("p", 15, "max number of petals")
psize = flag.Int("s", 30, "max length of petals")
opacity = flag.Int("o", 50, "max opacity (10-100)")
svg = svglib.New(os.Stdout)
)

const (
flowerfmt = `stroke:rgb(%d,%d,%d); stroke-opacity:%.2f; stroke-width:%d`
stemfmt = `stroke:green;stroke-opacity:0.3;stroke-width:%d`
)

func radial(xp int, yp int, n int, l int, style ...string) {
var x, y, r, t, limit float64
limit = 2.0 * math.Pi
r = float64(l)
svg.Gstyle(style[0])
for t = 0.0; t < limit; t += limit / float64(n) {
x = r * math.Cos(t)
y = r * math.Sin(t)
svg.Line(xp, yp, xp+int(x), yp+int(y))
}
svg.Gend()
}

func background(v int) { svg.Rect(0, 0, *width, *height, svg.RGB(v, v, v)) }

func random(howsmall, howbig int) int {
if howsmall >= howbig {
return howsmall
}
return rand.Intn(howbig-howsmall) + howsmall
}

func randrad(x, y int) {
var r, g, b, o, s, t, p int
r = rand.Intn(255)
g = rand.Intn(255)
b = rand.Intn(255)
o = random(10, *opacity)
s = random(10, *psize)
t = random(2, *thickness)
p = random(10, *np)
radial(x, y, p, s, fmt.Sprintf(flowerfmt, r, g, b, float64(o)/100.0, t))
}

func init() {
flag.Parse()
rand.Seed(time.Nanoseconds() % 1e9)
}

func main() {
svg.Start(*width, *height)
background(255)
svg.Gstyle(fmt.Sprintf(stemfmt, *stemwidth))
var x, l, xe, offset int
for i := 0; i < *ninter; i++ {
x = rand.Intn(*width)
l = rand.Intn(*stemlen)
offset = rand.Intn(*width / 10)
if rand.Intn(100) > *numleft {
xe = x - offset
} else {
xe = x + offset
}
svg.Line(x, *height, xe, *height-l)
randrad(xe, *height-l)
}
svg.Gend()
svg.End()
}


Sunday, March 21, 2010

Browser SVG Gallery - UI analysis


Browser SVG Gallery
Originally uploaded by ajstarks
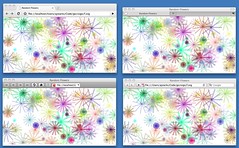
This grid shows four modern browsers: Chrome (5.0.307.11) , Firefox (3.6) , Opera (10.10) , and Safari (4.0.5) displaying SVG content generated by SVGo. The browser UI's have been muted to emphasize the content. Some observations:

1) Chrome: shows more "chrome" than any of the others. Lot's of head space with it's tab structure, with an emphasis on the omnibox, but with a minimal number of controls (back, forward, refresh)

2) Firefox: as minimal as it gets, except for the OS X furniture, only minimal tab controls are visible

3) Opera: lots of buttons with space for the address box, but all in a single row

4) Similar to Opera, but with fewer buttons (only back and forward). The big ol' Google box looks conspicuous.

Note that both Opera and Safari allow for all controls to be suppressed so that you are left with pure content:

Saturday, March 6, 2010

Processing vs. SVG Go


Processing vs. SVG Go
Originally uploaded by ajstarks
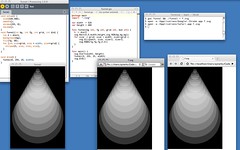
This screenshot compares developing the same graphic using Processing and the SVG Go Library.

Top row: from the left: Processing code, Go Code (in TextWrangler), Command lines to run the Go code

Bottom row: Processing output, Go-generated SVG rendered in Safari and Chrome

The workflow for Processing is familiar: enter code, hit the run button. For Go: edit/write code, move to a shell window, compile, open a browser.
For subsequent runs, just hit refresh in the browser to see the result.

Both methods support rapid prototyping and sketching -- the Go compiles are so fast it's almost the same as hitting the run button in Processing. As you can see the results are identical

In terms of code, both environments are similar -- there is almost a one-to-one correspondence, however SVG and Processing treat ellipse width differently.

I note that the syntax highlighting of graphics functions in Processing tells me at a glance what the program is doing -- this is less apparent with the Go program.

Wednesday, December 9, 2009

TweetFreq Go Language web Server (wtf): Browser, console, source

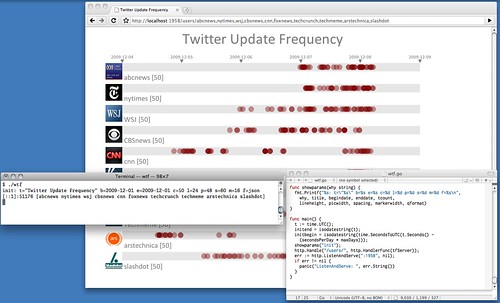
TweetFreq Go Language web Server (wtf): Browser, console, source

wtf is a specialized web server that also acts as client to twitter. wtf acts as a "compiler" for the browser, responding to requests with optimized "pre-cooked" JavaScript canvas directives---think of it as assembly language for the code in the browser that interprets canvas tag data. For example:


C.beginPath();C.arc(799,167,8,0,p2,true);C.fill(); 


draw the markers. All computations like coordinate and object positioning is done by the wtf, not the browser.
Currently, wtf retrieves JSON from twitter. The XML results were over 2 times slower (with a slight loss of data, the JSON results lack the full name of the twitter user).


wtf takes about 5.6 seconds to build a tweetfreq from 10 users
(abcnews,nytimes,wsj,cbsnews,cnn,foxnews,techcrunch,techmeme,arstechnica,slashdot)
consisting of 500 tweets. The bulk of the time is waiting for the
twitter search engine to respond.


wtf responds to requests in this format:


 /users/{userlist}?b={date}&e={date}&c={count}&m={marker-width}&p={picture width}&l={line-width}&s={spacing}

which specify the users and search/graphics/layout parameters

/users/ajstarks,nytimes,%23golang,cnn?b=2009-12-05&e=2009-12-09&c=100&m=12&p=48&l=24&s=60 

builds a visualization of the twitter update frequency for the users ajstarks, nytimes, cnn, and the mentions of the #golang hashtag during the period between December 5-9, 2009 (UTC), up to 100 tweets/user, with a marker width of 12 pixels, a picture width of 48 pixels,
line width of 24 pixels, with spacing of 60 pixels.

Planned updates include support for twitter lists in the form of

/lists/{user}/{listname}

(improved support for authentication in the http package would be
helpful here...)

More on TweetFreq

Wednesday, November 18, 2009

Parsing JSON and ATOM Twitter Search Results in Go

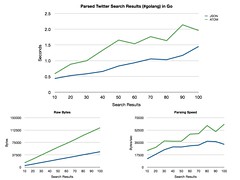
The top chart shows the time a Go program takes to search twitter, parse the results, and output the tweets, varying the number of search results from 10-100. The blue shows the results for JSON, the green for ATOM (XML).

Also depicted is the number of bytes to parsed, and the resulting parsing rate.

The conclusion is that JSON is more efficient; HTTP rates are constant, but JSON requires less data, with less complex data structures to unmarshal. Both methods deliver identical results:

ts -f json -n 10 '#golang'

RT @koizuka: RT @tokuhirom: #golang は C/C++ のかわりにつかうというよりは。python のかわりに使うという領域の方がおおきいんだとおもう
RT @tokuhirom: #golang は C/C++ のかわりにつかうというよりは。python のかわりに使うという領域の方がおおきいんだとおもう

Here is the program: it demonstrates command line parsing, error checking, http processing and unmarshaling both JSON and XML.


// ts -- twitter search
//
// Anthony Starks (ajstarks@gmail.com)
//

package main

import (
"fmt"
"http"
"io"
"io/ioutil"
"flag"
"os"
"xml"
"json"
)


type JTweets struct {
Results []Result
}

type Result struct {
From_user string
Text string
}

type Feed struct {
XMLName xml.Name "http://www.w3.org/2005/Atom feed"
Entry []Entry
}

type Entry struct {
Title string
Author Person
}

type Person struct {
Name string
}

type Text struct {
Type string "attr"
Body string "chardata"
}

var (
format = flag.String("f", "atom", "Output format (json or atom)")
nresults = flag.Int("n", 20, "Maximum results (up to 100)")
since = flag.String("d", "", "Search since this date (YYYY-MM-DD)")
)

const (
queryURI = "http://search.twitter.com/search.%s?q=%s&rpp=%d"
outputfmt = "%s \u27BE %s\n"
)


func ts(s string, how string, date string, n int) {

var q string
if len(date) > 0 {
q = fmt.Sprintf(queryURI+"&since=%s", how, http.URLEscape(s), n, date)
} else {
q = fmt.Sprintf(queryURI, how, http.URLEscape(s), n)
}

r, _, err := http.Get(q)
defer r.Body.Close()
if err != nil {
fmt.Fprintf(os.Stderr, "%v\n", err)
return
}
if r.StatusCode == http.StatusOK {
switch how {
case "atom":
readatom(r.Body)
case "json":
readjson(r.Body)
}
} else {
fmt.Fprintf(os.Stderr,
"Twitter is unable to search for %s as %s (%s)\n", s, how, r.Status)
}
}

func readatom(r io.Reader) {
var twitter Feed
err := xml.Unmarshal(r, &twitter)
if err != nil {
fmt.Fprintf(os.Stderr, "Unable to parse the Atom feed (%v)\n", err)
return
}
for _, t := range twitter.Entry {
fmt.Printf(outputfmt, t.Author.Name, t.Title)
}

}

func readjson(r io.Reader) {
var twitter JTweets
b, err := ioutil.ReadAll(r)
if err != nil {
fmt.Fprintf(os.Stderr, "%v\n", err)
return
}
jerr := json.Unmarshal(b, &twitter)
if jerr != nil {
fmt.Fprintf(os.Stderr, "Unable to parse the JSON feed (%v)\n", jerr)
return
}
for _, t := range twitter.Results {
fmt.Printf(outputfmt, t.From_user, t.Text)
}
}

func main() {
flag.Parse()
for i := 0; i < flag.NArg(); i++ {
ts(flag.Arg(i), *format, *since, *nresults)
}
}

Monday, November 16, 2009