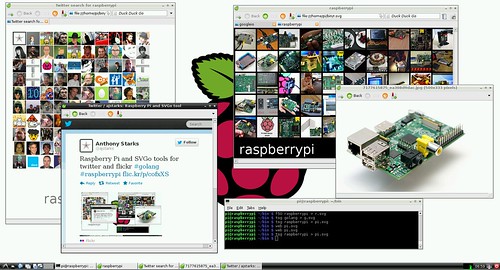
The Raspberry Pi includes a GPU-backed OpenVG standard library, making it an excellent platform for graphics programming. This post describes a high-level library written on top of OpenVG that can be used with either C or Go.
Design
The library, hosted at Github, is a thin layer on top of the native OpenVG library (see /opt/vc/lib), adopting its coordinate system (origin at the lower left, x increasing to the left-to-right, y increasing up), and types (floating point coordinates and dimensions).
The library is designed to be small and logical---a programmer should be be able to keep the entire API in their head, and at a glance get a sense of what a client program will do. The usual pattern is to define programs in terms of functions that use high-level graphics objects likes circles, lines, and curves, with little to no barrier between the conception of the design and its programmed realization---the library is designed to get to the pictures quickly, with a minium of ceremony and boilerplate. If a picture can be created with a vector drawing tool, the designer/programmer should be able to create an equivalent (or better) illustration using the library.
Another measure of the API is its ability to program pictures defined in other APIs such as Processing or SVGo.
API
The API is organized in terms of shapes, lines, curves, text, images, attributes, and transformations. (note that the library adopts Go's convention of using upper-case names for "public" functions)
|
| Shapes, lines and curves |
|
Circle(x,y,r) | Circle centered at (x,y) with radius r |
Ellipse(x,y,w,h) | Ellipse centered at (x,y), with radii w, h |
Rect(x,y,w,h) | Rectangle with lower left at x,y width of w, height of h |
Roundrect(x,y,w,h,rw,rh) | Rounded rectangle with lower left at (x,y), width (w), height (h), corner radii (rw,rh) |
Line(x1,y1, x2,y2) | Line between (x1, y1) and (x2, y2) |
Polyline(x,y) | Polyline with coordinates in (x,y) arrays |
Polygon(x,y) | Polygon with coordinates in (x,y) arrays |
Arc(x,y,w,h,a1,a2) | Arc centered at x,y width (w), height (h), between angles a1,a2 |
Cbezier(bx,by, cx,cy, px,py, ex,ey) | Cubic Beziér curve between (bx, by) and (ex, ey), with control points at (cx,cy) and (px,py) |
Qbezier(bx,by, cx,cy, ex,ey) | Quadratic Beziér curve between (bx, by) and (ex, ey), with the control point at (cx,cy) |
|
| Image and Text |
|
Image(x,y,w,h,name) | Place the JPEG image file "name", and dimensions of (w,h) at (x,y) |
Text(x,y,s,font,size) | Place the text in s at (x,y), set in the named font and size |
TextMid(x,y,s,font,size) | Align the text centered at (x,y), set in the named font and size |
TextEnd(x,y,s,font,size) | Align the text with its end at (x,y), set in the named font and size |
TextWidth(s,font,size) | Return the width of a string of text set in the named font and size |
SerifTypeface | Specifies the built-in serif typeface (Deja Vu Sans) |
SansTypeface | Specifies the built-in sans-serif typeface (Deja Vu Serif) |
MonoTypeface | Specifies the built-in monospaced typeface (Deja Vu Sans Mono) |
|
| Attributes |
|
Fill(red,green,blue,alpha) | Set the fill color specified by the (red,green,blue) triple. Color transparency is defined by alpha |
FillLinearGradient(x1,y1,x2,y2,stops,n) | Linear gradient fill |
FillRadialGradient(cx,cy,fx,fy,r,stops,n) | Radial gradient fill |
Stroke(red,green,blue,alpha) | Set the stroke color |
StrokeWidth(w) | Set the stroke width |
Background(red,green,blue) | Set the background color |
|
| Transformations |
|
Translate(x,y) | Translate the coordinate system to (x,y) |
Scale(x,y) | Scale the coordinate system by (x,y) |
Shear(x,y) | Warp the coordinate system by (x,y) |
Rotate(r) | Rotate the coordinate system around the angle r (degrees) |
|
| Structure |
|
init() | Graphics initialization |
finish() | Graphics cleanup |
Start(w,h) | Begin the picture |
End() | End the current picture |
SaveEnd(filename) | Save the raw raster to filename, and empty string saves the raster to the standard output file |
Text is rendered with TrueType fonts, using data generated by an included separate program, font2openvg. The library embeds data for sans, serif and monospace fonts in a single weight. Other fonts may be added if needed. The format for saved pictures is a stream of RGBA values, in scanline order, sized to the display. The included Go program raw2png converts the raw raster files to PNG.
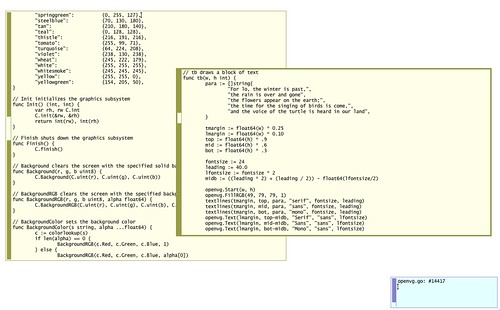
Here's a "reference card" for the library, built with itself:
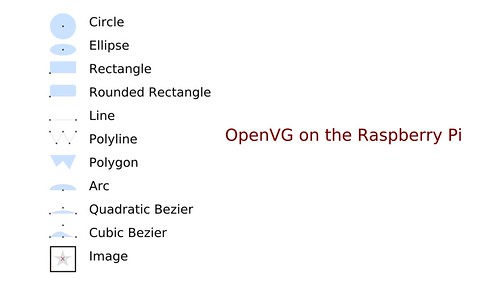
Here is the formal description of the C API
Examples
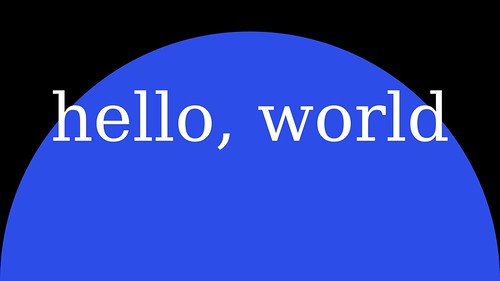
Every first program displays "hello, world" -- here is the graphics equivalent.
// first OpenVG program
#include <stdio.h>
#include <stdlib.h>
#include <unistd.h>
#include "VG/openvg.h"
#include "VG/vgu.h"
#include "fontinfo.h"
#include "shapes.h"

int main() {
    int width, height;
    VGfloat w2, h2, w;
    char s[3];

    init(&width, &height);                                      // Graphics initialization

    w2 = (VGfloat)(width/2);
    h2 = (VGfloat)(height/2);
    w  = (VGfloat)w;

    Start(width, height);                                       // Start the picture
    Background(0, 0, 0);                                        // Black background
    Fill(44, 77, 232, 1);                                       // Big blue marble
    Circle(w2, 0, w);                                           // The "world"
    Fill(255, 255, 255, 1);                                     // White text
    TextMid(w2, h2, "hello, world", SerifTypeface, width/10);   // Greetings
    End();                                                      // End the picture
    fgets(s, 2, stdin);                                         // Pause until RETURN]
    finish();                                                   // Graphics cleanup
    exit(0);
}
This example is a function to rotate text:
// rotext draws text, rotated around the center of the screen, progressively faded
void rotext(int w, int h, int n, char *s) {
    VGfloat fade = (100.0 / (VGfloat) n) / 100.0;
    VGfloat deg = 360.0 / n;
    VGfloat x = w / 2, y = h / 2;
    VGfloat alpha = 1.0;    // start solid
    int i, size = w / 8;

    Start(w, h);
    Background(0, 0, 0);
    Translate(x, y);
    for (i = 0; i < n; i++) {
        Fill(255, 255, 255, alpha);
        Text(0, 0, s, SerifTypeface, size);
        alpha -= fade;             // fade
        size += n;                 // enlarge
        Rotate(deg);
    }
    End();
}

The Go Package
Thanks to the work of the Go community, specifically Dave Cheney and Shenghou Ma (known as minux on the Go mailing lists), Go is a first-class language on the Raspberry Pi -- building a Go version of the library is straightforward using cgo. When building Go initially on your Raspberry Pi, it's useful to decrease the GPU RAM, but once it's built, you will need at least 64MB of GPU RAM to run the programs. Use the raspi-config program to adjust your memory split. While you are there, experiment with the new "Turbo" overclocking mode. Your builds will go faster.
The key to a successful build is respecting the Go toolchain conventions -- the code is built under $GOPATH/src/github.com/ajstarks/openvg, so that during development I can say:
$ cd $GOPATH/src/github.com/ajstarks/openvg
$ go install .
$ cd go-client/shapedemo
$ go run shapedemo.go demo 1
Incidentally, I grew weary of the twitchiness of editing using vi over ssh on my Mac, and using Plan 9 from user space, I can use the text editor sam between the Raspberry Pi and the Mac for much more responsive editing.
The Go version includes with a few niceties such as named colors, and in general, where the C library uses arrays, Go uses slices, and where OpenVG uses the VGfloat type the Go package uses float64. Also, the C library only supports JPEG images, but the Go library supports both JPG and PNG image formats, thanks to the standard image library.
A formal description of the Go API
Here is the Go version of the hellovg program:
// first OpenVG program
package main

import (
    "bufio"
    "github.com/ajstarks/openvg"
    "os"
)

func main() {
    width, height := openvg.Init()                            // Graphics initialization

    w2 := float64(width / 2)
    h2 := float64(height / 2)
    w := float64(width)

    openvg.Start(width, height)                               // Start the picture
    openvg.BackgroundColor("black")                           // Black background
    openvg.FillRGB(44, 77, 232, 1)                            // Big blue marble
    openvg.Circle(w2, 0, w)                                   // The "world"
    openvg.FillColor("white")                                 // White text
    openvg.TextMid(w2, h2, "hello, world", "serif", width/10) // Greetings
    openvg.End()                                              // End the picture
    bufio.NewReader(os.Stdin).ReadBytes('\n')                 // Pause until [RETURN]
    openvg.Finish()                                           // Graphics cleanup
}
The rotext function:
// rotext draws text, rotated around the center of the screen, progressively faded
func rotext(w, h, n int, s string) {
    fade := (100.0 / float64(n)) / 100.0
    deg := 360.0 / float64(n)
    x := float64(w) / 2.0
    y := float64(h) / 2.0
    alpha := 1.0
    size := w / 8

    openvg.Start(w, h)
    openvg.Background(0, 0, 0)
    openvg.Translate(x, y)
    for i := 0; i < n; i++ {
        openvg.FillRGB(255, 255, 255, alpha)
        openvg.Text(0, 0, s, "serif", size)
        alpha -= fade // fade
        size += n     // enlarge
        openvg.Rotate(deg)
    }
    openvg.End()
}
Building and running
You will need at least 64MB of GPU RAM, and the only other dependecy is the JPEG library, install it like this:
$ sudo apt-get install libjpeg8-dev
Makefiles control the building of the C library and its clients.
$ make # builds the C and Go libraries
$ cd client
$ make test # builds C clients
$ ./shapedemo # show a reference card
$ ./shapedemo advert # show the library "billboard"
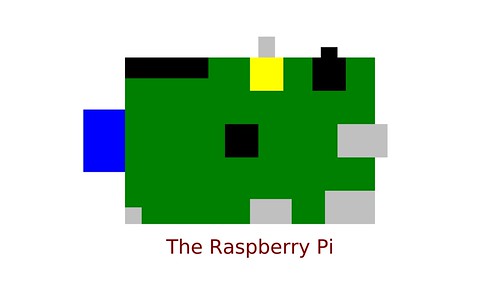
$ ./shapedemo raspi # show a self-portrait
$ ./shapedemo image # show test images
$ ./shapedemo astro # the sun and the earth, to scale
$ ./shapedemo text # show blocks of text in serif, sans, and mono fonts
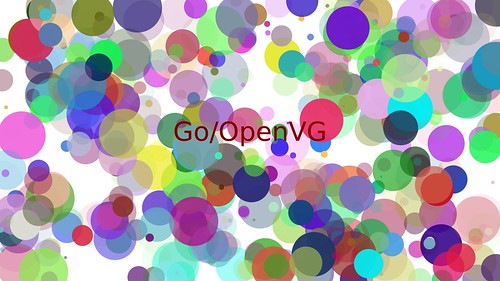
$ ./shapedemo rand 100 # show 100 random shapes
$ ./shapedemo rotate 10 a # rotated and faded "a"
$ ./shapedemo gradient # show linear and radial gradient fills
$ ./shapedemo test "hello, world" # show a test pattern, with "hello, world" at mid-display in sans, serif, and mono.
$ ./shapedemo fontsize # show a range of font sizes (see Better Products Through Typography)
$ ./shapedemo demo 10 # run through the demos, pausing 10 seconds between each one.
The Go package and clients are built using the go tool: (make sure you are on a recent
Go release. As of this writing, the openvg library has been tested on Go 1.1 and 1.1.1
$ go get github.com/ajstarks/openvg
$ go install github.com/ajstarks/openvg/...
The Go clients include:
- shapedemo -- cycle through several demos (see above)
- colortab -- named color table
- raspi -- the Raspberry Pi self-portait
- hellovg -- hello (graphics) world
- randcircle -- show random circles
Issues and Opportunities
The library is young, and can be improved: the font handling is less than ideal, and Rob Bishop of the Raspberry Pi foundation has pointed out the Raspberry Pi includes a vector font library.
The handling of image data between Go and C is not optimal and is the only performance regression between the Go and C versions of the library. Other areas of improvement include better handing of paths (currently the library creates and destroys paths for each graphics object, negatively effecting performance), and adding mouse and keyboard handling. Image handling and scaling can also be improved.
The API is fairly stable, and I'd like to see what kind of programs can be written, letting real-world needs drive API changes (gradient fills are on the to-do list). UPDATE:
linear and gradient fills were added on October 2, 2012
Example programs include graphical information/status displays, where portions of the display can be updated concurrently using goroutines, or even presentation software that works from a simplified markup. (try the Go version of the shapedemo with the "loop" argument for a hint of what's possible). The library could also be the basis of a graphics learning environment that is takes advantage of fully accelerated 2D-graphics.
Happily, there is very little Raspberry Pi-specific code, so theoretically the library could be ported to any system that supports OpenVG, useful in future GUI framework and tools.
Have fun programming pictures on your Raspberry Pi