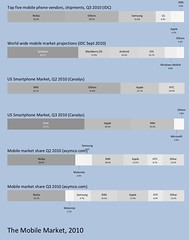
Here is a collection of pmaps that outline the changing mobile market share. The data is from Canalys, IDC, CNet, and Asymco.com
Monday, November 1, 2010


Thursday, October 7, 2010
Proportional Maps: an alternative to pie charts
Proportional maps (pmaps) are an alternative to the venerable pie chart for showing the how a set of data adds up to a whole.
The input XML format is simple: a pmap consists of one or more data sets (pdata elements), which in turn contain items with a corresponding value:
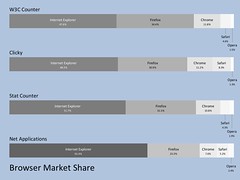
Pmaps are designed to show the data more clearly than pie charts by using color (the darker the color the greater the proportion), size (the width of the rectangle corresponds to the data's proportion) and position (the data is ordered from greater to least proportion).
The compact nature of pmaps allows you to compare related datasets by scanning vertically. For example the illustration shows how different sources report browser market share.
The pmap program is implemented in the Go programming language, and produces SVG via the svgo library
The program has various strategies to clearly show all the data: you may show any combination of labels, percentages, or raw data. The labels and data are automatically arranged for maximum visibility: if the data rectangle is too narrow, its labels is displayed as a call out. (the thresholds for label length and data size are adjustable). The style of call out is also configurable: staggered or alternating between above and below the data)
The command line:
pmap -stagger -p -g 100 -bg lightsteelblue -t "Browser Market Share" -showtitle bs.xml > bs.svgcreated the illustration above. It means: read data from bs.xml, create the pmap as a SVG file called bs.svg, stagger the overflow labels, show percentages, separate each map with 100 pixels, create a contrasting background, and display a title.
The input XML format is simple: a pmap consists of one or more data sets (pdata elements), which in turn contain items with a corresponding value:
<pmap>
<pdata legend="W3C Counter">
   <item value="43.2">Internet Explorer</item>
   <item value="31.2">Firefox</item>
   <item value="10.7">Chrome</item>
   <item value="4.2">Safari</item>
   <item value="1.4">Opera</item>
</pdata>
</pmap>
Friday, August 13, 2010
A quick tour of Go's dict package
The 2010-08-11 release of the Go programming language includes the dict package to talk to dictionary servers as defined by RFC 2229. Let's check it out.
First, here's a mimimal program that uses the Dial() and Define() functions to display a definition.
package main

import "net/dict"

func main() {
 c, _ := dict.Dial("tcp", "dict.org:2628")
 defn, _ := c.Define("wn", "go")
 for _, result := range defn {
    println(string(result.Text))
 }
}
This program does no error checking, and has three hardcoded bits: the server (dict.org:2628), the database ("wn") and word to lookup ("go").
For the next version, let's add some flexibility -- lookup items specified on the command line, and let's add some error checking and cleanup:
package main

import (
 "net/dict"
 "os"
)

func main() {
 c, neterr := dict.Dial("tcp", "dict.org:2628")
 if neterr == nil {
    defer c.Close()
    for _, word := range os.Args {
       defn, deferr := c.Define("wn", word)
       if deferr == nil {
          for _, result := range defn {
             println(string(result.Text))
          }
       }
    }
 }
}
Ok, great, what if you want to switch databases? You can ask the server. If you run the command with no arguments, it will list the available databases using the Dicts() function:
package main

import (
 "net/dict"
 "os"
)

func main() {
 c, neterr := dict.Dial("tcp", "dict.org:2628")
 if neterr == nil {
    defer c.Close()
    if len(os.Args) == 0 {
       dicts, dicterr := c.Dicts()
       if dicterr == nil {
          for _, dl := range dicts {
             println(dl.Name, dl.Desc)
          }
       }
    } else {
       for _, word := range os.Args {
          defn, deferr := c.Define("wn", word)
          if deferr == nil {
             for _, result := range defn {
                println(string(result.Text))
             }
          }
       }
    }
 }
}
One more update: let's add flags to specify the dict server and database. We'll also update the error processing to show the errors instead of failing silently:
package main

import (
 "net/dict"
 "flag"
 "fmt"
)
var (
 db      = flag.String("d", "wn", "Dictionary database")
 dserver = flag.String("s", "dict.org:2628", "Dictionary Server")
)

func main() {
 flag.Parse()
 c, neterr := dict.Dial("tcp", *dserver)
 if neterr == nil {
    defer c.Close()
    if len(flag.Args()) == 0 {
       dicts, dicterr := c.Dicts()
       if dicterr == nil {
          for _, dl := range dicts {
             fmt.Println(dl.Name, dl.Desc)
          }
       } else {
          fmt.Println(dicterr)
       }
    } else {
       for _, word := range flag.Args() {
          defn, dferr := c.Define(*db, word)
          if dferr == nil {
             for _, result := range defn {
                fmt.Println(string(result.Text))
             }
          } else {
             fmt.Println(dferr)
          }
       }
    }
 } else {
    fmt.Println(neterr)
 }
}
There you go--a robust, flexible dictionary client in a little over 40 lines of code.
Friday, April 16, 2010
Font Specimens with SVG
These font specimens were created with SVGo, patterned after the specimens found in wikipedia

Here are the current and past defaults for Microsoft Office, Calibri and Times Roman
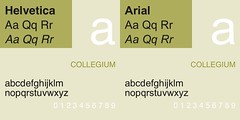
The original vs. the knock-off: Helvetica and Arial.
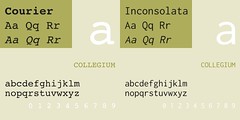
And finally, the canonical mono-spaced font Courier compared to Inconsolata, my current go-to monofont
Wednesday, March 24, 2010
Leaning Flowers

Here is another variation of grain2. It's like the "flower" program, but it includes stems, and a porportion of "lean" (0 - full lean to the left, 100 - full lean to the right) is programmed in.
The variations were produced with this script:
for i in 0 25 50 75 100
do
  ./grain -n 150 -w 900 -h 200 -l 175 -nl $i > grain$i.svg
done

Grain 0

Grain 25

Grain 50

Grain 75

Grain 100
Here's the Go program
// grain -- flowers with programmable lean

package main

import (
    svglib "./svg"
    "time"
    "rand"
    "os"
    "flag"
    "fmt"
    "math"
)

var (
    width     = flag.Int("w", 500, "width")
    height    = flag.Int("h", 500, "height")
    ninter    = flag.Int("n", 75, "interations")
    stemlen   = flag.Int("l", 450, "stem length")
    stemwidth = flag.Int("st", 4, "stem thickness")
    numleft   = flag.Int("nl", 50, "percentage of left-leaning stems")
    thickness = flag.Int("t", 10, "max petal thinkness")
    np        = flag.Int("p", 15, "max number of petals")
    psize     = flag.Int("s", 30, "max length of petals")
    opacity   = flag.Int("o", 50, "max opacity (10-100)")
    svg       = svglib.New(os.Stdout)
)

const (
  flowerfmt = `stroke:rgb(%d,%d,%d); stroke-opacity:%.2f; stroke-width:%d`
  stemfmt = `stroke:green;stroke-opacity:0.3;stroke-width:%d`
)

func radial(xp int, yp int, n int, l int, style ...string) {
    var x, y, r, t, limit float64
    limit = 2.0 * math.Pi
    r = float64(l)
    svg.Gstyle(style[0])
    for t = 0.0; t < limit; t += limit / float64(n) {
        x = r * math.Cos(t)
        y = r * math.Sin(t)
        svg.Line(xp, yp, xp+int(x), yp+int(y))
    }
    svg.Gend()
}

func background(v int) { svg.Rect(0, 0, *width, *height, svg.RGB(v, v, v)) }

func random(howsmall, howbig int) int {
    if howsmall >= howbig {
        return howsmall
    }
    return rand.Intn(howbig-howsmall) + howsmall
}

func randrad(x, y int) {
    var r, g, b, o, s, t, p int
    r = rand.Intn(255)
    g = rand.Intn(255)
    b = rand.Intn(255)
    o = random(10, *opacity)
    s = random(10, *psize)
    t = random(2, *thickness)
    p = random(10, *np)
    radial(x, y, p, s, fmt.Sprintf(flowerfmt, r, g, b, float64(o)/100.0, t))
}

func init() {
    flag.Parse()
    rand.Seed(time.Nanoseconds() % 1e9)
}

func main() {
    svg.Start(*width, *height)
    background(255)
    svg.Gstyle(fmt.Sprintf(stemfmt, *stemwidth))
    var x, l, xe, offset int
    for i := 0; i < *ninter; i++ {
        x = rand.Intn(*width)
        l = rand.Intn(*stemlen)
        offset = rand.Intn(*width / 10)
        if rand.Intn(100) > *numleft {
            xe = x - offset
        } else {
            xe = x + offset
        }
        svg.Line(x, *height, xe, *height-l)
        randrad(xe, *height-l)
    }
    svg.Gend()
    svg.End()
}
Sunday, March 21, 2010
Browser SVG Gallery - UI analysis
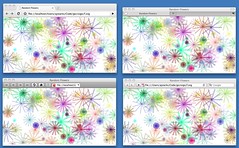
This grid shows four modern browsers: Chrome (5.0.307.11) , Firefox (3.6) , Opera (10.10) , and Safari (4.0.5) displaying SVG content generated by SVGo. The browser UI's have been muted to emphasize the content. Some observations:
1) Chrome: shows more "chrome" than any of the others. Lot's of head space with it's tab structure, with an emphasis on the omnibox, but with a minimal number of controls (back, forward, refresh)
2) Firefox: as minimal as it gets, except for the OS X furniture, only minimal tab controls are visible
3) Opera: lots of buttons with space for the address box, but all in a single row
4) Similar to Opera, but with fewer buttons (only back and forward). The big ol' Google box looks conspicuous.
Note that both Opera and Safari allow for all controls to be suppressed so that you are left with pure content:
1) Chrome: shows more "chrome" than any of the others. Lot's of head space with it's tab structure, with an emphasis on the omnibox, but with a minimal number of controls (back, forward, refresh)
2) Firefox: as minimal as it gets, except for the OS X furniture, only minimal tab controls are visible
3) Opera: lots of buttons with space for the address box, but all in a single row
4) Similar to Opera, but with fewer buttons (only back and forward). The big ol' Google box looks conspicuous.
Note that both Opera and Safari allow for all controls to be suppressed so that you are left with pure content:
Saturday, March 6, 2010
Processing vs. SVG Go
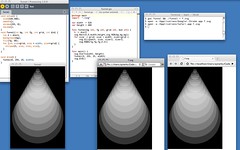
This screenshot compares developing the same graphic using Processing and the SVG Go Library.
Top row: from the left: Processing code, Go Code (in TextWrangler), Command lines to run the Go code
Bottom row: Processing output, Go-generated SVG rendered in Safari and Chrome
The workflow for Processing is familiar: enter code, hit the run button. For Go: edit/write code, move to a shell window, compile, open a browser.
For subsequent runs, just hit refresh in the browser to see the result.
Both methods support rapid prototyping and sketching -- the Go compiles are so fast it's almost the same as hitting the run button in Processing. As you can see the results are identical
In terms of code, both environments are similar -- there is almost a one-to-one correspondence, however SVG and Processing treat ellipse width differently.
I note that the syntax highlighting of graphics functions in Processing tells me at a glance what the program is doing -- this is less apparent with the Go program.
Top row: from the left: Processing code, Go Code (in TextWrangler), Command lines to run the Go code
Bottom row: Processing output, Go-generated SVG rendered in Safari and Chrome
The workflow for Processing is familiar: enter code, hit the run button. For Go: edit/write code, move to a shell window, compile, open a browser.
For subsequent runs, just hit refresh in the browser to see the result.
Both methods support rapid prototyping and sketching -- the Go compiles are so fast it's almost the same as hitting the run button in Processing. As you can see the results are identical
In terms of code, both environments are similar -- there is almost a one-to-one correspondence, however SVG and Processing treat ellipse width differently.
I note that the syntax highlighting of graphics functions in Processing tells me at a glance what the program is doing -- this is less apparent with the Go program.
Subscribe to:
Posts (Atom)