Wednesday, July 11, 2012

AIGA Symbols

AIGA Symbols by ajstarks
AIGA Symbols, a photo by ajstarks on Flickr.

This display of AIGA symbols from The Noun Project was created with the SVGo library and the "nouns" program.

nouns -j -n 10  aiga/*.svg

The program works by loading SVG files from thenounproject, wrapping them in group elements, and then applying random location, scale, color, opacity, and rotation. These properties are define by the type:

type Props struct {
    x, y    int
    c       string
    s, o, r float64
}

Here's the function that does the work:

func Jumble(s *svg.SVG, icons []string, w, h, n int) {
    for c := 0; c < n; c++ {
        for _, i := range icons {
            RandProps(w, h).Apply(s, i)
        }
    }
}

Given a list of icons names, defined by SVG group ids, create and apply random properties bound by a width and height to the ids

Saturday, June 30, 2012

Raspberry Pi and SVGo tools

Raspberry Pi and SVGo tools by ajstarks
Raspberry Pi and SVGo tools, a photo by ajstarks on Flickr.

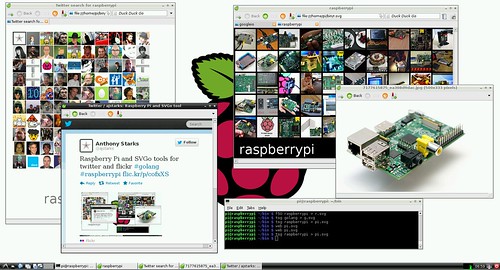
Here's a screenshot of SVGo tools running on the Raspberry Pi. On the left is tsg (twitter search grid) referring to twitter posts mentioning raspberrypi and on the is left f50 (flickr50) showing flickr photos tagged with raspberrypi.

Both tools produce links to detail -- a tweet and the actual flickr photo.

The Raspberry Pi is using the Midori browser to show the SVG content generated by the tools in the terminal window.

Sunday, April 22, 2012

Tumblr Grid

Attending the inaugural golang ny group at the Tumblr offices, inspired me to add tumblrgrid to the collection of SVGo clients. Tumblrgrid makes a SVG file that displays a flexible, clickable grid of pictures from a set tumblr blogs, possibly filtered with tags. Data may be read from a live network or from a local cache. You can get tumblrgrid with:
$ go get github.com/ajstarks/svgo/tumblrgrid
You will need to edit the source to add your own tumblr API key. The command options are:
 -f=false: read from local files
 -g=5: gutter (pixels)
 -n=30: picture limit
 -nc=5: number of columns
 -p=false: link to original post
 -tag="": filter tag
 -tw=75: thumbnail width
An interesting use of tumblrgrid is to view pictures from related tumblrs. For example, this list:
f0o0od.tumblr.com
ign0ranceisbliiiss.tumblr.com
agilaagira.tumblr.com
geek-art.tumblr.com
represents a chain of tumblrs that refer to each other. After collecting them in a file called tlist, this command line:
$ tumblrgrid -nc 4 -n 20 `cat tlist`
produces:
Changing the command line to
$ tumblrgrid -nc 2 -n 20 `cat tlist`
reduced the number of columns to 2 which causes the labels to be rotated.

Saturday, October 15, 2011

Documenting Code and Pictures

For the SVGo workshop I had to document many examples of code+pictures, so I created a workflow to create consistently formatted illustrations of SVGo code and the pictures they produce. Below is the script that automates the process. The heart of the script is a small Go program, codepic which creates a SVG file of code and picture:
Here's the script:
#!/bin/sh
for i in $*
do
    base=`basename $i .go`
    gofmt -w -spaces -tabindent=false -tabwidth=4 $i &&
    goc $base && 
    ./${base} > ${base}.svg && 
    codepic -codeframe=f -font Inconsolata -fs 14 -ls 16 $i > ${base}-slide.svg && 
    svg2pdf ${base}-slide.svg
done
for each file the script:
  1. formats the source
  2. builds the source
  3. runs the program and captures its output
  4. make a slide showing the code and output
  5. convert the slide to PDF for inclusion in Keynote

Sunday, August 7, 2011

Stock/Product Comparisons with SVGo


The latest visualization tool written with SVGo is stockproduct, a tool to compare stock prices with the release of products over time. This is a Go version of the tool described earlier. Like other SVGo tools, stockproduct reads data from XML (see example below) and produces SVG.

<stockproduct title="Apple Purchases and Stock Price">
<sdata price="12.40" date="2002-04" product="Ti PowerBook" image="tipb.jpg"/>
<sdata price="7.38" date="2002-08" product="Jaguar" image="jaguar.png"/>
<sdata price="261.09" date="2010-04" product="iPad 3G" image="ipad3g.jpg"/>
<sdata price="399.68" date="2011-07" product="Lion" image="lion.png"/>
</stockproduct>

The example above plots my purchases of Apple products vs. the stock price.

Stockproduct scales the graph by the specified size, and the graph can be placed anywhere on the SVG canvas. Note that every chart component: bars, images, product names. prices, scales, and images may be turned on and off using command line options.

This example:

compares the adjusted closing price vs. operating system releases from Microsoft and Apple, ordered by the date of release. Between 1991-2001, both organizations were able to keep pace, with Microsoft releasing Windows 3.1, 95, 98, and Apple releasing System 7, 8, and 9.

However, between 2001 and 2005 Apple steadily released five versions of Mac OS X (Cheetah, Puma, Jaguar, Panther, and Tiger), but in the same time period, Microsoft released only XP. After 2005, Apple released Leopard, Snow Leopard and Lion, where Microsoft released VIsta and Windows 7.

From 1991-2007, there were no large differences in stock prices, but in 2007, the there was large gain for Apple, growing from $184.70 to $386.90, with Microsoft's price staying flat, at $23.75 at the release of Windows 7 in 2007.

In fact the range of prices and releases during past 20 years is Microsoft: $2-23.75, and 6 operating system releases, with Apple's stock price ranging from $4.11 - $386.90, with 11 operating system releases (not including iOS).

Here's the same data with Apple products on the left, peaking at Lion, and Microsoft products on the right:

Monday, July 11, 2011

Bullet Graphs with SVGo


Bullet Graphs

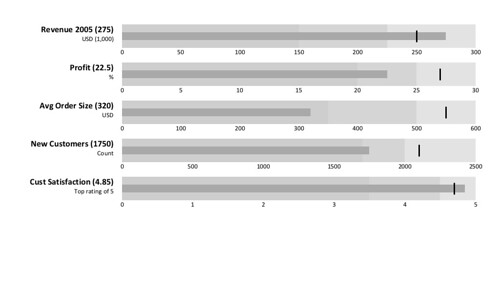
Here is the output of bulletgraph -- an implemetation of Few's Bullet Graphs using SVGo. Like pmaps, bulletgraph reads a XML representation of the data, unmarshals the input into data structures, and produces the bullet graph from the structures. The input looks like this:

<bulletgraph>
<bdata title="Revenue 2005" subtitle="USD (1,000)"
scale="0,300,50" qmeasure="150,225" cmeasure="250" measure="275"/>
</bulletgraph>

Each bdata element produces a graph according to its attributes (titles, scales, and measures)

The program has various options to control colors of the various components (data color, comparative color, target color), and the indicator showing the target measure can either be the conventional vertical line or a circle. The -help option shows all of the option flags, with an example XML definition.

bulletgraph -help

Usage: bulletgraph [options] file...

-bc="rgb(200,200,200)": bar color
-bg="white": background color
-bh=48: bar height
-cc="black": comparative color
-circle=false: circle mark
-dc="darkgray": data color
-f=18: fontsize (px)
-g=30: gutter
-h=800: height
-help=false: usage and example
-showtitle=false: show title
-t="Bullet Graphs": title
-w=1024: width

Example Defintion:

<bulletgraph top="50" left="250" right="50">
<bdata title="Revenue 2005" subtitle="USD (1,000)" scale="0,300,50" qmeasure="150,225" cmeasure="250" measure="275"/>
<bdata title="Profit" subtitle="%" scale="0,30,5" qmeasure="20,25" cmeasure="27" measure="22.5"/>
<bdata title="Avg Order Size" subtitle="USD" scale="0,600,100" qmeasure="350,500" cmeasure="550" measure="320"/>
<bdata title="New Customers" subtitle="Count" scale="0,2500,500" qmeasure="1700,2000" cmeasure="2100" measure="1750"/>
<bdata title="Cust Satisfaction" subtitle="Top rating of 5" scale="0,5,1" qmeasure="3.5,4.5" cmeasure="4.7" measure="4.85"/>
</bulletgraph>
Thanks to Richard Masci for the example usage suggestion.

Monday, May 16, 2011

Google Web Fonts, SVGo and code sketching with goplay


SVGo and Google web fonts
This program, webfonts, demonstrates Google Web Fonts and its API with SVGo. The key to its operation is the URI:
http://fonts.googleapis.com/css?family={fonts}

where {fonts} is a pipe-delimited list of font names. The result of performing a HTTP GET on this URI is CSS code that specifies the fonts. For example,

http://fonts.googleapis.com/css?family=Pacifico 
produces:
@font-face {
font-family: 'Pacifico';
font-style: normal;
font-weight: normal;
src: local('Pacifico'), url('http://themes.googleusercontent.com/font?kit=fKnfV28XkldRW297cFLeqfesZW2xOQ-xsNqO47m55DA') format('truetype');
}

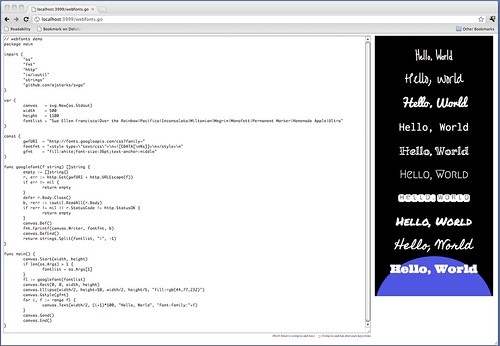
The program works by using a Go function to perform the GET (googlefont(fontname string)), and place the resulting CSS in a SVG defs element. The program is then able to use the web fonts by name just like any other local font. In this case looping over the names in the list, and displaying "Hello, World" in the corresponding font.

The screenshot shows the code and output in Google Chrome (although any modern browser that can handle inline SVG will work), using a web app that comes with the Go distribution, goplay. Goplay allows you to "play" with snippets of Go code and quickly compile and see the results in a web browser. In the case of programs like the one shown, the generated SVG is placed in-line, interpreted directly, showing the picture.

Here's how to run it: go to a directory where your code lives, and then run goplay -html, which sends the results unaltered to the browser, instead of in a plain text block. A word of caution from the goplay documentation: anyone with access to the goplay web interface can run arbitrary code on your computer. Goplay is not a sandbox, and has no other security mechanisms. Do not deploy it in untrusted environments.

cd [dir]
goplay -html
Next, point your browser to the content served by goplay (which listens on localhost, port 3999 by default):

http://localhost:3999/webfonts.go

Your code will be shown in the textarea, ready to be edited and built. Hit Shift-ENTER and code is compiled and run with the output next to the code. If you want to tweak the program, by changing say, a font name or the string to be displayed, just move to the textarea, make the change, and hit Shift-ENTER again. This method allows you to sketch in code, with immediate feedback.

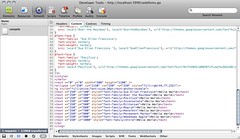
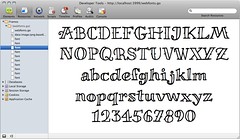
With the WebKit Inspector found in Chrome and Safari, you can examine timing, code, and font information.


SVGo and Webfonts: network timing

SVGo and Webfonts: generated code

SVGo and Webfonts: font resource