Benchviz reads data from the benchcmp command, found in $GOROOT/misc/benchcmp, which produces output like this:
$ benchcmp old new
benchmark                 old ns/op    new ns/op    delta
BenchmarkBinaryTree17  131488202467 112637283111  -14.34%
BenchmarkFannkuch11     61976254131  61972329989   -0.01%
BenchmarkGobDecode        424145307    383073401   -9.68%
BenchmarkGobEncode        115032849    120332484   +4.61%
BenchmarkGzip           13868472766  13493855517   -2.70%

benchmark                  old MB/s     new MB/s  speedup
BenchmarkGobDecode             1.81         2.00    1.10x
BenchmarkGobEncode             6.67         6.38    0.96x
BenchmarkGzip                  1.40         1.44    1.03x
BenchmarkGunzip               11.23        11.55    1.03x
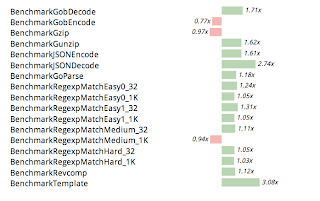
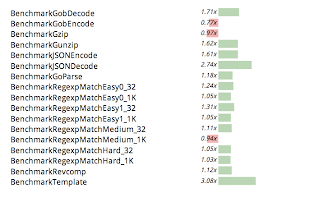
The benchcmp command produces two kinds of comparisons. "delta-style" shows the percent change between the measurements (negative numbers for going faster, positive numbers for slowdowns). The "speedup-style" shows how many times faster or slower the benchmarks are. Measurements less than 1.0 are considered performance regressions.
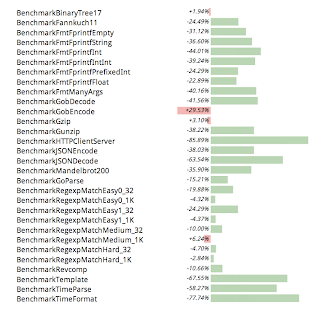
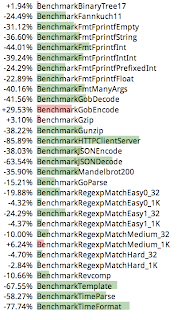
Benchviz supports two styles: the "bar" style draws a barchart-like view; regressions point to the left and speedups go to the right. The "inline" view shows portportionally-sized bars as "highlights" over the benchmark names. In both cases, colors indicate speedups or regressions.
If you add lines to the benchcmp output beginning with '#', benchviz will display these comment lines appropriately
Bars and inline styles


Two styles of speedup benchmarks


To install benchviz:
$ go install github.com/ajstarks/svgo/benchvizYou can run benchviz in a pipeline:
$ benchcmp old new | benchviz > bench.svg
or it can read from files:
$ benchviz linux-amd64-282dcbf1423.txt > linux.svg
Benchviz has options to control layout (overall width and height, top and left margins; the location and size of the bars; maximum speedup and delta) and style (bars or inline, colors, horizontal rules, single column data view)
$ benchviz -?
flag provided but not defined: -?
Usage of benchviz:
  -bh=20: bar height
  -col=false: show data in a single column
  -dm=100: maximum delta
  -h=768: height
  -left=100: left margin
  -line=false: show lines between entries
  -rcolor="red": regression color
  -scolor="green": speedup color
  -sm=10: maximum speedup
  -style="bar": set the style (bar or inline)
  -title="": title
  -top=50: top
  -vp=512: visualization point
  -vw=300: visual area width
  -w=1024: width
Thanks to Dave Cheney and Andrew Gerrand for feedback and encourgement.